

Friday, 17 December 2010
Thursday, 16 December 2010
The Future of GIS Mapping for Emergency Management
When I think GIS mapping, I think ESRI. While there are other companies out there, ESRI pretty much dominates the government market when it comes to computer based maps. I was able to have a conversation with one of their staff today at their booth at the Denver UASI Conference. Here are snippets of what I learned from Paul Christin:
* ESRI is moving to a "one map" look. The idea being to have the maps and the navigation tools all look the same across their platforms to enhance the user's interface. This would be for desktop, enterprise and mobile.
* More applications are coming all the time. He showed me a nifty free one that searches for Twitter-Tweets in a specific geographical area. That would be a great situational tool you could use now when there is an incident.
* He sees 4G providing a little better speed, but the real advantage is multi-tasking on your smart phone/mobile device. You will be able to be on the phone talking, looking at a map, manipulating the data and sending the map to others all at the same time. Nifty!
* I asked which states are heavy into computer/GIS mapping and using the tool in their EOCs and for planning. Answer: Virginia, Florida, Georgia, Texas Public Safety.
* ARC GIS10 will give you your map data over time. So imagine you have basically screen shots of what you knew and when geographically displayed and retrievable. This will be a great documentation tool for after the event when people question the decisions that were made. The map will give you that situation at the time and provide the justification for what you did. A wonderful tool.
I'm convinced that just as in security the future is all about technology, so too in emergency management and homeland security we will see our major advances in the near term come from the integration of technology into what we are doing.
Remember, there is no better display in your EOC than that of an Operational Map generated by computer! I think we are finally getting to the point where we will be able to make the tool "sing and dance."
Tuesday, 14 December 2010
Location Lucrative: Check-in Services Boast Coveted Demographics
BY Austin Carr
Foursquare now boasts 5 million users with 25,000 newcomers signing up every day. But that massive growth isn't the only reason the company turned down a $140 million offer (likely from Yahoo), as revealed this week. The demographics of its users may be far more valuable in the long run.
According to a report released Friday by Forrester Research, location-based services such as Foursquare and Gowalla are attracting some top clientele. Location-based app users are far younger and more affluent than the average online user. Around 86% of those checking in are under the age of 43. More than 70% of users have earned a college degree or higher. And most impressively, the average annual income stands at $105,000--at least 30% more than the average Netizen.
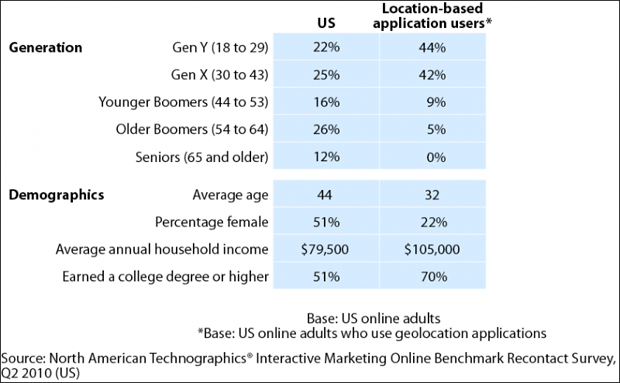
What's more, location-based users are very influential, reports Venture Beat. "Geolocation users are 38% more likely than the average U.S. online adult to say that friends and family ask their opinions before making a purchase decision," wrote Forrester's Reineke Reitsma.
These are demographics that advertisers covet. The only issue here are the services' adoption rates. A previous report from Forrester showed just 4% of online adults have ever used check-in services.
But the trajectory of Gowalla and Foursquare--with so many users signing up daily--might not slow advertisers from checking in, too
Monday, 13 December 2010
Where it all Started:Web Mapping 2.0: The Neogeography of the GeoWeb
Muki Haklay, Alex Singleton1 and Chris Parker
The landscape of Internet mapping technologies has changed dramatically since
2005. New techniques are being used and new terms have been invented and entered
the lexicon such as: mash-ups, crowdsourcing, neogeography and geostack. A
whole range of websites and communities from the commercial Google Maps to
the grassroots OpenStreetMap, and applications such as Platial, also have emerged.
In their totality, these new applications represent a step change in the evolution
of the area of Internet geographic applications (which some have termed the
GeoWeb
it has implications both for geographers and the public notion of Geography. This
article provides a critical review of this newly emerging landscape, starting with
an introduction to the concepts, technologies and structures that have emerged
over the short period of intense innovation. It introduces the non-technical
reader to them, suggests reasons for the neologism, explains the terminology, and
provides a perspective on the current trends. Case studies are used to demonstrate
this Web Mapping 2.0 era, and differentiate it from the previous generation of
Internet mapping. Finally, the implications of these new techniques and the
challenges they pose to geographic information science, geography and society at
large are considered.
). The nature of this change warrants an explanation and an overview, as1 Introduction
From an early start over 15 years ago, the use of the Internet to deliver
geographic information and maps is burgeoning. However, within this
period, there has been a step change in the number of users and more
importantly in the nature of applications that, in their totality, are now
termed ‘The Geographic World Wide Web’ or ‘the GeoWeb’. The number
of visitors to public Web mapping sites provides an indication of this
change. In mid-2005, the market leader in the UK (Multimap) attracted
7.3 million visitors and, in the USA, Mapquest was used by 47 million
visitors. By the end of 2007, Google Maps was used by 71.5 million and
Google Earth by 22.7 million (
mid-2007, there were over 50,000 new websites that are based on Google
Wall Street Journal 2007). Moreover, by2012 Web Mapping 2.0 and neogeography
© 2008 The Authors
Journal Compilation © 2008 Blackwell Publishing Ltd
Geography Compass 2/6 (2008): 2011–2039, 10.1111/j.1749-8198.2008.00167.xMaps (Tran 2007) whereas in the previous era of Internet mapping, the
number of mapping websites was significantly smaller due to technical and
financial barriers.
This dramatic landscape change is accompanied by neologism of its
own.
being used such as: map mash-ups, crowdsourcing, mapping application
programming interfaces (API), neogeography, geostack, tags, geotechnologies
and folksonomies. These rapid developments in Web mapping and
geographic information use are enabled and facilitated by global trends in
the way individuals and communities are using the Internet and new
technologies to create, develop, share and use information (including geographic
information), through innovative, often collaborative, applications.
The term ‘Web 2.0’ is frequently used to describe these trends and was
first coined by Tim O’Reilly on 30 September 2005 at the first Web 2.0
Conference. He later clarified his definition as:
1 New terms are being coined to describe new techniques that areWeb 2.0 is the business revolution in the computer industry caused by the
move to the Internet as platform, and an attempt to understand the rules for
success on that new platform. (O’Reilly 2006)
The term ‘Geospatial Web’ implies the merging of geographic (locationbased)
information with the abstract information that currently dominates
the Internet. Notice that while the term ‘Geospatial’ has a long history
(see Kohn 1970 for one of the first uses of the term), it has gained
increasing popularity within the recent past to describe computer handling
of geographic information. There has been an increased awareness by
numerous Web 2.0 technologists of the importance of geography and
location as a means to index and access information over the Internet. As
a result, over the last few years, geographic information could be argued
to have firmly entered the mainstream information economy. We will use
the term ‘Web Mapping 2.0’ to describe this new phase in the evolution
of the geospatial Web. As Goodchild (2007a, 27) noted,
[T]he early Web was primarily one-directional, allowing a large number of
users to view the contents of a comparatively small number of sites, the new
Web 2.0 is a bi-directional collaboration in which users are able to interact
with and provide information to central sites, and to see that information
collated and made available to others.
The purpose of this article is to provide the non-technical reader with a
review of this short period of intense innovation, which is rapidly changing
the Web mapping landscape. This will review the historical growth of
Web mapping and an introduction to the latest concepts, technologies and
structures; explain the characteristics and trends of Web Mapping 2.0
supported by case studies; and discuss the implications and opportunities
of these developments on geographic information science, geography,
geographic information providers and society.
© 2008 The Authors
Journal Compilation © 2008 Blackwell Publishing Ltd
Geography Compass 2/6 (2008): 2011–2039, 10.1111/j.1749-8198.2008.00167.xWeb Mapping 2.0 and neogeography 2013
Noteworthy is the fact that the examples we are using are all UK-based.
Development of Web 2.0 is happening across the globe, but several
important activities have occurred in the UK over the past few years. For
example, the open geographic information project OpenStreetMap started
in London, and the Ordnance Survey is the first national mapping agency
to release a Web-based open application programming interface for the
use of its products.
Before turning to the body of the article, it is worth outlining the core
of our argument. As the discussion below will show, the recent changes
have not created new functionality in geographic information delivery.
Internet-based information delivery has a 15-year history and, for example,
the functionality that allows the integration of information from multiple
websites (mash-up) was possible by utilising the Open Geospatial Consortium
(OGC) standards since 2000. The concept of the geostack – the
multiple technological components that allow collecting, storing and sharing
geographic information – has been appearing in the literature for almost
40 years as geographic information system (GIS) (see Kohn 1970) or in its
Internet incarnation in the OGC documentation. Thus, the change is not
of increased functionality, rather how emerging technologies have created
new approaches to geographic information distribution and, most importantly,
in the usability and ease of application development. Previous
reviews (Plewe 2007; Tsou 2005; Turner 2006) have provided a good
introduction to the technical developments; however, they have not
explained the consequences of these changes. The aim of this article is to
combine the technical and societal analysis to explain the emergence of
Web Mapping 2.0 and, more importantly, why the concept of neogeography
emerged.
2 The GeoWeb – the First Decade
Internet mapping started early after the emergence of the World Wide
Web (WWW or Web) with the introduction of the Xerox PARC Map
Viewer in 1993 (Putz 1994). This application provided very rudimentary
capabilities – the ability to present a map of the world, zooming at
predefined scales and controlling the visibility of rivers and border features.
Technically, the ability of the WWW at this time was to create a Web
page (a Hypertext Markup Language or HTML file) in which an image
file is embedded. The interaction between the user and the map was
implemented by a computer code (a Common Gateway Interface or CGI
script), which ran on the Web server. Each time the user clicked on one
of the links on the page, the user’s Web browser sent a request to the
server. The request encoded in it the coordinates of the area that the user
was interested in and other options such as the layers that were to be
displayed. Once the server received the request, it would execute the CGI
script, which would produce the HTML page and the associated image
2014 Web Mapping 2.0 and neogeography
© 2008 The Authors
Journal Compilation © 2008 Blackwell Publishing Ltd
Geography Compass 2/6 (2008): 2011–2039, 10.1111/j.1749-8198.2008.00167.xfile that presented the new map, and then transfer these files over the
Internet to the user’s computer. Once the files were received, the user’s
browser would render them and show them on the computer’s screen.
This interaction mode led to a delay of a few seconds between the
user’s action (the click on the map) and the rendering of the map on the
screen, with a visible refresh of the whole browser window when the new
page was downloaded. This interaction model was the core of most of the
Web mapping applications for the next decade. Figure 1 provides an
example of a process of digitising an area object on an Internet mapping
site, using this interaction mode.
The early 1990s saw a very rapid increase in the development of delivery
mechanisms for geographic information and mapping over the Internet
and the WWW. While Doyle et al. (1998), Plewe (1997), and Peng and
Tsou (2003) provide a comprehensive review of these developments,
Plewe (2007) is especially valuable in identifying four technical eras in the
Fig. 1. Digitising of area over the Internet – transactions between client and server.
© 2008 The Authors
Journal Compilation © 2008 Blackwell Publishing Ltd
Geography Compass 2/6 (2008): 2011–2039, 10.1111/j.1749-8198.2008.00167.xWeb Mapping 2.0 and neogeography 2015
development of Internet mapping. In order of increasing complexity, users
accessed Web mapping by three main methods: public mapping sites, Web
(or Internet) Mapping Servers, and more sophisticated Geographic Web
Services.
The most popular mode of Web mapping provision was through public
mapping sites. In the UK, Multimap.com was developed in 1995 to
deliver maps to mobile phones, but ended with a highly successful public
mapping site, which was launched in 1996 (Parker 2005). In the same
year, MapQuest was launched in the USA (Peterson 1997). Other similar
websites included Streetmap, Yahoo! Maps, Microsoft’s MapPoint, and
Map24. The main characteristics of all these services are that they provide
access to simple queries about locations and directions. The user could
explore the map image through options to scroll the map by clicking on
areas at the edge of the map. A similar procedure enabled the user to
zoom in and out. Figure 2 shows the Multimap website circa 2005.
By and large, the services were limited to information preloaded by the
provider and allowed little customisation by end users. Furthermore, as
Figure 2 illustrates, most of the maps were restricted in size due to limitations
in the end user’s computer monitor resolution and other demands
on the design of a page such as advertisements. In addition, the image file
containing the map tended to be bigger in size than the Web page that
Fig. 2. Multimap website, early 2005.
2016 Web Mapping 2.0 and neogeography
© 2008 The Authors
Journal Compilation © 2008 Blackwell Publishing Ltd
Geography Compass 2/6 (2008): 2011–2039, 10.1111/j.1749-8198.2008.00167.xcontained it. Therefore, network latency coupled with the limited data
transfer capacity (bandwidth) of the end users’ dial-up modems encouraged
developers to minimise the size of the map.
Noteworthy is the impact of all these factors on the use of Web mapping
sites – from the user’s perspective, the process was slow and therefore
the experience not especially pleasurable, so the websites were used in a
limited way without detailed exploration of the map.
The ability to deliver maps over the Internet was also important for
organisations who wanted to use their own datasets and create applications
with sophisticated analytical capabilities. Here, most GIS vendors offered
Web Mapping Server (WMS) software that could be installed on a local
Web server. The way in which the mapping information was delivered to
the user varied from relying on the capabilities of the browser similar to
public mapping websites, to downloaded software that needed installation
before the user could view the data and extended the capabilities of the
browser (Peng and Tsou 2003). These applications borrowed their interaction
metaphors from desktop GIS and, therefore, required the user to
familiarise themselves with the application before they could use it. As
Traynor and Williams (1995) noted, the terminology in GIS borrows from
multiple disciplines, and this creates a major obstacle for new users. An
example for this type of application is provided in Figure 3 which shows
Fig. 3. UK Environment Agency website 2002.
© 2008 The Authors
Journal Compilation © 2008 Blackwell Publishing Ltd
Geography Compass 2/6 (2008): 2011–2039, 10.1111/j.1749-8198.2008.00167.xWeb Mapping 2.0 and neogeography 2017
such an application from 2002, created by the UK Environment Agency
to provide environmental information to the public. Notice the especially
small area of the map and the use of GIS terminology in the interface
(data layers, query layer, zoom in, zoom out, etc.). In order to query the
map, the user needs to select the layer to be queried, and also the option
‘What’s that on the map?’ – a rather complex operation.
While the Web Mapping Servers were designed to allow browsing,
searching, downloading and rudimentary editing capabilities, the need for
highly sophisticated services over the Internet was covered by Geographic
Web Services software (such as ESRI’s ArcServer). This class of software
allowed the use of high-end analytical capabilities (for an example of such
an application, see Simao et al. forthcoming). However, Geographic Web
Services are beyond the scope of this article, and for a complete discussion,
see Tang and Selwood (2003). What is important to note is that, similar
to WMS, the end-user interface was complex and sophisticated.
The OGC standards are the final elements of the GeoWeb that it is
important to understand before turning to Web Mapping 2.0.
With its origins in the mid-1990s, the OGC (www.opengeospatial.org) became
a significant force in the GIS arena by setting standards for interoperability
(Peng and Tsou 2003), thus allowing users of GIS to share data and
processing, and use software and data from a wide range of providers. This
is significant because of those high costs associated with data in terms of
acquisition and manipulation for a specific task. Therefore, it is very
important that an organisation can use software and data from different
sources without costly and complex data conversion procedures. Common
standards for integration of data and software provide the needed bridge
that enables such interoperability.
Since 2000, the OGC has developed a set of standards for Web mapping.
The first was the Web Mapping Service specifications (OGC 2000).
These allowed WMS software to publish geographic information stored
on multiple servers, often in disparate locations, and in a format that was
suitable for further processing by multiple software that adopted the OGC
standards. This ability was significant, as it realised the possibility of rapidly
producing a map through the aggregation of readily available information
to provide a new service. An example exercise used in the development
of the standard focused on how information from meteorological remote
sensing satellites could be integrated with information about population
to provide an early warning of hurricanes (Gawne-Cain and Holcroft
2000). In the years that have passed since the introduction of the OGC
Web Mapping Service specifications, many software products that are
compatible with the standard have appeared in the marketplace. However,
the utilisation of real-world complex WMS applications remains the
domain of GIS experts in specialised areas. This lack of adoption can be
partially associated with the technical complexity of the standards. From
an end user’s perspective, the standards are confusing and do not necessarily
2018 Web Mapping 2.0 and neogeography
© 2008 The Authors
Journal Compilation © 2008 Blackwell Publishing Ltd
Geography Compass 2/6 (2008): 2011–2039, 10.1111/j.1749-8198.2008.00167.xmeet user needs. Finally, many of the implementations were slow and did
not provide an effective experience.
In summary, until about 2005, delivery of geographic information and
GIS capabilities over the Internet was possible and increasingly more
sophisticated but a combination of factors limited their use. Developing
an Internet-based mapping application remained complex, and this limited
the number of developers and kept the cost of Web mapping high. Importantly,
as most of these Internet mapping applications rely on some
background cartography, this required purchasing expensive background
maps outside the USA, or, even where public domain geographic information
are available (USA), a significant knowledge in manipulating these datasets
and preparing them for delivery is required.
Finally, from an end user perspective, the delivery of geographic information
in a graphical form was limited due to network bandwidth,
especially as when these standards were first introduced many users were
still using dial-up links to the Internet.
3 Global Positioning System and Web 2.0: The Technologies of Change
The increased availability of higher capacity domestic Internet connections,
and the reducing costs associated with those devices, which enable quick
acquisition of locational information, created the necessary conditions
enabling a step change in the delivery of geographic information over the
Internet. Many other factors would also have contributed, including
increased computing power relative to price and continued development
of Internet technologies such as eXtensible Markup Language (XML), Simple
Object Access Protocol and others. Two groups of technologies have had
special importance in enabling much of Web Mapping 2.0: global positioning
system (GPS); and Web 2.0 technologies, particularly Asynchronous
JavaScript and XML (AJAX) and APIs. This section describes these technologies,
the characteristics of Web 2.0, and the profound contribution they
are making to Web mapping. For further analysis of the enabling factors,
see Friedman’s (2006), Goodchild’s (2007b), and Plewe’s (2007) analyses.
3.1
GLOBAL POSITIONING SYSTEMThe 1 May 2000 should be celebrated as one of the most significant days
for neogeography – maybe even its official birthday. On this day, the US
President, Bill Clinton, announced the removal of selective availability of
the GPS signal (Clinton 2000), and by so doing provided an improved
accuracy for simple, low-cost GPS receivers. In normal conditions, this
made it possible to acquire the position of the receiver with accuracy of
6–10 m, in contrast to 100 m before the ‘switch off ’. Attempts to develop
location-based services predated this announcement (e.g. Giordano et al.
1995), and were based on information from mobile phone masts or other
© 2008 The Authors
Journal Compilation © 2008 Blackwell Publishing Ltd
Geography Compass 2/6 (2008): 2011–2039, 10.1111/j.1749-8198.2008.00167.xWeb Mapping 2.0 and neogeography 2019
beacons. However, these methods had not gained much market share due
to technical complexity or lack of coverage. By mid-2001, it was possible
to purchase a receiver unit for about US$100 (Hightower and Borriello
2001). These receivers enabled more people than ever before to collect
information about different locations and upload this information to their
computers. However, until 2002, when an interchange standard (GPX)
was published, the sharing of this information was a complicated task that
required computing and data manipulation knowledge. The GPX standard
has been rapidly adopted by most developers of GPS systems and by 2004
it had become commonplace (Foster 2004).
3.2
WEB 2.0 TECHNOLOGIES AND AJAXThe GPX belongs to a class of standards and technologies that provides
the infrastructure for what came to be known as Web 2.0. The impacts
of Web 2.0 can be considered in terms of the underpinning technologies
and the characteristics of application development and use they enable.
While initial popular use of the Web was characterised by websites that
enabled the distribution of information in new ways but with a limited
interaction, the technologies of Web 2.0 provide a far richer user interaction
and experience. Several factors have provided a platform for these
new applications. First, as a result of the Dot Com bubble of the late
1990s, a massive data transfer capacity became available at very low costs,
enabling the proliferation of broadband services to home users. Second,
technology companies developed standards that allowed the transfer of
information between distributed systems in different locations. This family
of standards (including OGC standards and GPX) were based on XML.
Another innovation, which integrates XML-based standards and allows
the development of sophisticated applications, is the AJAX (for an accessible
explanation of these developments and their lineage, see Friedman 2006,
pp. 51–93). As Zucker (2007) notes, the most important innovation in
AJAX is in the ability to fetch information from a remote server in
anticipation of the user’s action and provide interaction without the need
to refresh the whole Web page. This changes the user experience dramatically
and makes the Web application more similar to a desktop application
where the interaction mode is smooth. A decade earlier, this was possible
through the use of additional software but, as the embedded application
was not an integral part of the Web page, the experience of using the
mapping application was not very satisfying because it forced the user to
learn another set of interaction rules in addition to the main modes that
are common on the Web (see also Tsou 2005). AJAX-based geographical
applications look and feel very different. First, the area of the screen that
is served by the map has increased dramatically, thus improving the usability
of Web mapping significantly (Haklay and Zafiri 2007; Skarlatidou and
Haklay 2006). Second, the ability to interact within the browser’s window
2020 Web Mapping 2.0 and neogeography
© 2008 The Authors
Journal Compilation © 2008 Blackwell Publishing Ltd
Geography Compass 2/6 (2008): 2011–2039, 10.1111/j.1749-8198.2008.00167.xchanged the mode from the ‘click-and-wait-for-a-page-refresh’ to direct
manipulation of the map – a mode of interaction familiar in other desktop
applications, and more akin to desktop GIS.
3.3
APPLICATION PROGRAMMING INTERFACEA third technological difference that has direct relevance to the discussion
here is the appearance of APIs. In the first decade of Web mapping, the
development of a well-functioning WMS application (such as MapServer
or ArcIMS) required significant knowledge in programming and server
management. Even packages like Manifold GIS or Microsoft’s MapPoint,
which used a generic Web programming framework, required significant
investment in developer time to learn how to use their functionality.
In addition, through the API, users have access to centralised pools of very
high-resolution background geographic data including maps, satellite data,
street photography and building outlines. APIs are relatively easy to use and
have made application development more accessible, thus enabling a far larger
community of people who could create, share and mash up (geographic)
information as illustrated in the examples we give in the next section.
We argue that the technologies outlined in this section have encouraged
a far wider adoption of the use of geographic applications because finally,
after a decade of development, Web mapping has been given simpler tools
that, when deployed, enable a more pleasurable and effective user experience.
Unlike the previous generation of Web mapping sites, the mode of interaction,
the speed of the response and the ability to experiment with new
ways of integrating geographic information with other types of information
has encouraged many programmers and users to utilise geographic information
in their applications. These technologies have provided the
ingredients for a new type of Web mapping.
4 The Emergence of Neogeography
Central to Web Mapping 2.0 is the concept of neogeography. The term
is attributed to Di-Ann Eisnor (2006) of Platial.com – ‘a socially networked
mapping platform which makes it easy to find, create, share, and publish
maps and places’ and the essence of neogeography according to Turner:
Neogeography means ‘new geography’ and consists of a set of techniques and
tools that fall outside the realm of traditional GIS, Geographic Information
Systems. Where historically a professional cartographer might use ArcGIS, talk
of Mercator versus Mollweide projections, and resolve land area disputes, a
neogeographer uses a mapping API like Google Maps, talks about GPX versus
KML, and geotags his photos to make a map of his summer vacation.
Essentially, Neogeography is about people using and creating their own
maps, on their own terms and by combining elements of an existing toolset.
© 2008 The Authors
Journal Compilation © 2008 Blackwell Publishing Ltd
Geography Compass 2/6 (2008): 2011–2039, 10.1111/j.1749-8198.2008.00167.xWeb Mapping 2.0 and neogeography 2021
Neogeography is about sharing location information with friends and visitors,
helping shape context, and conveying understanding through knowledge of
place.
Lastly, Neogeography is fun . . . (Turner 2006, 2–3)
The contrast offered in this definition is between perceived tedious, slow,
boring and expensive practices of cartographers and geographers, and
enjoyable, rule breaking and relevant uses of geographic information by
laypersons. As will be discussed later, this disregard to past practices is part
of the zeitgeist that is central to Web Mapping 2.0.
The advent of the above technologies and standards discussed in the
previous section have led to the emergence of numerous neogeography
applications which utilise the Google, Yahoo and Microsoft (GYM) mapping
APIs to create rich geographic websites.
An early example appeared a few weeks after Google released their
mapping service in 2005. Paul Radamacher developed a new site that
merged information from the San Francisco-based free small-ads website
Craigslist with Google information in a site called HousingMaps (Tran 2007).
This process of combining information from several websites and sources
to produce a new Web service became known as a mash-up. Importantly,
the speed of broadband connections allowed his server to connect to
Craigslist and Google Maps servers and deliver the combined information
so quickly that from the end-user perspective the interaction was seamless
and pleasing. The simplicity of the Google Maps implementation enabled
him to reprogram it for his needs. Shortly afterwards, Google released an
official API which made it even easier to develop and implement mapping
applications. As of June 2007, there were over 50,000 Google Maps mash-ups
(Tran 2007). Importantly, most of the mash-ups are the equivalent of push
pins that have been located on a map, with some multimedia information
– mostly text but sometime images or video clip – attached to the pin.
The APIs are a very significant enabling factor of Web Mapping 2.0
applications, both in terms of providing mapping functionality and highresolution
background data. This was exemplified immediately following
Hurricane Katrina in the USA in 2005. While OGC WMS specifications
provided at least the same technical functionality as map mash-ups, it was
the latter that were rapidly developed and used (Miller 2006). In the event
of this real disaster, the OGC specification languished: ‘. . . many, many
[Geospatial] applications were built, only a handful support OGC standards’
(OGC 2005). This admission was of particular irony considering, as
noted early, that the OGC specifications testbed scenario was a response
to a hurricane in southeastern USA (Gawne-Cain and Holcroft 2000).
This failure can be attributed to the ease of use of Web Mapping 2.0 APIs
compared to the relative complexity and obscurity of OGC standards.
Several different categories of neogeography mash-ups have emerged,
which are differentiated by their methods of data collection: whether they
2022 Web Mapping 2.0 and neogeography
© 2008 The Authors
Journal Compilation © 2008 Blackwell Publishing Ltd
Geography Compass 2/6 (2008): 2011–2039, 10.1111/j.1749-8198.2008.00167.xintegrate data or services from other sources through an API, or whether
they supply data back to the community through their own API.
Neogeography websites do not necessarily rely on user-generated
content to supply innovative services and instead some supply data which
they collect from disparate or difficult to access sources. The core innovations
in these websites are the methods by which they collect and package
information to enable other uses. An example of this type of website is
Nestoria (www.nestoria.com), which gathers information from numerous
estate agents about the spatial location of properties for sale or rent in the
UK and Spain. Visitors to the Nestoria website can enter their property
search requirements and the Nestoria application returns a list of properties
for sale matching these criteria and displays them as push pins on top of
a Google map. Nestoria also provides an API to allow other websites to
use their property database or integrate it with a Geobrowser like Google
Earth.
Neogeography examples also include innovative uses of non-mapping
websites to display spatial information. Flickr (www.flickr.com) is a photosharing
website where users can upload pictures and add metadata to a
picture such as a description and ‘tags’. Tags are much like keywords for
a journal article, describing the main topics covered within a paper. In
Flickr, these can refer to the content of a picture, for example, a photograph
of a bowl of fruit may have a tag of ‘fruit’, or can be created by
drawing boxes around elements within a picture. These tags appear when
a viewer of an image hovers their cursor over a tagged area. A novel use
of tags has appeared in the development of the ‘Memory Maps’ group
within Flickr. In this, users upload screen shots taken from Google Maps
and then annotate them with tags detailing memories people have about
these areas (Figure 4).
Another way to use tags is by georeferencing an image with geographic
coordinates, in a process called geotagging. On Flickr, this can be done
by dragging the image to a location on a map, or through the use of
GPX files. As with other neogeography jargon, geotagging is not adding
anything new, apart from being Web specific, as the term
been widely used for over 40 years to describe the association of a piece
of information with a location.
Tags form an important characteristic in Web 2.0 and allow users to
create their own semantic categorisation of online content. These ‘Folksonomies’
(Vander Wal 2007) decentralise the formal classification of objects
into fixed partitions, and instead use virtual classification schema based on
meta-information defined by users. Although this decentralisation of
information organisation may appear progressive, Weinberger (2007, 165)
warns that these classifications can, however, mislead because ‘tags have
no context’. These folksonomies contrast to top-down taxonomies of spatial
information (ontologies), which are created by experts (Fonseca et al. 2000).
Tags have been utilised in neogeography applications in a number of
geocoding has© 2008 The Authors
Journal Compilation © 2008 Blackwell Publishing Ltd
Geography Compass 2/6 (2008): 2011–2039, 10.1111/j.1749-8198.2008.00167.xWeb Mapping 2.0 and neogeography 2023
innovative ways: for example, the concept of Tag Clouds, which demonstrate
the popularity of tags as a graphic visualisation where words scaled
by their popularity have been extended through the development of ‘Tag
Maps’ (Slingsby et al. 2007) that represent the ‘importance’ and location
of geographically referenced text. The applications developed by Slingsby
et al. (2007) display a range of spatiotemporally referenced search engine search
terms (Figure 5) on top of Google Earth. The purpose of this visualisation
technique is to present a summary of those activities being conducted by
users of the Internet across space and time by geographic areas.
5 Technologies of Cooperation and Web Mapping 2.0
Before turning to case studies that demonstrate specific applications that
draw on Web Mapping 2.0-related technologies and characteristics, it is
important to understand the social context of these developments.
Since the early 1990s, developments in computer-mediated communication
(CMC) have enabled groups of people to use networked computers
to accomplish collaborative activities. Rheingold (1994, 110) discussed in
relation to early developments on the Internet that CMC enables people
to ‘rediscover the power of cooperation, turning cooperation into a game,
Fig. 4. The First Flickr Memory Map (URL: http://www.flickr.com/photos/mathowie/8496262/).
2024 Web Mapping 2.0 and neogeography
© 2008 The Authors
Journal Compilation © 2008 Blackwell Publishing Ltd
Geography Compass 2/6 (2008): 2011–2039, 10.1111/j.1749-8198.2008.00167.xa way of life – a merger of knowledge capital, social capital and communion’.
Rheingold was not alone – books like
et al. 2000), articles such as ‘Computer Networks as Social Network’
(Wellman et al. 1996) and many others called for, and emphasised, the role
of the Internet and the Web in creating and sustaining social networks and
social activities. Significantly, the interest in the use of networked computers
for accomplishing collaborative geographic tasks has been an integral part
of GIScience over the same period, and there is now a substantive body
of literature on collaborative GIS and geographic applications (see Balarm
and Dragicevic 2006; Jankowski and Nyerges 2001) and discussion about
the geographic aspects of these virtual communities appear in numerous
geographic literatures since the 1990s (Batty 1997; Graham 1998; and
many others). Yet, until fairly recently, large-scale collaborative systems in
which millions of users could share information were slow to emerge.
One infamous and early example is the Geocities website created in
1994, which allowed users a free account to create a personal website. At
its height, it was one of the most popular websites on the Internet, with
The Cluetrain Manifesto (LevineFig. 5. Interactive timelines for exploration. Tags are constrained to Friday night (top) and
Saturday morning and early afternoon (bottom) (Source: Slingsby et al. 2007).
© 2008 The Authors
Journal Compilation © 2008 Blackwell Publishing Ltd
Geography Compass 2/6 (2008): 2011–2039, 10.1111/j.1749-8198.2008.00167.xWeb Mapping 2.0 and neogeography 2025
over 3.3 million users (Bassett and Wilbert 1999; Brown 2001). Due to a
range of technical and organisational reasons combined with blunders
such as overwhelming the sites with pop-up advertisements, the site
quickly deteriorated towards the end of the 1999 (see detailed analysis in
Brown 2001). Geocities promoted claims of establishing a community
online, and encouraged users to interact through online chat rooms and
bulletin boards, but, at the end, the community had withered.
Increased bandwidth and connectivity options have increased the
number of people with access to the Internet and ushered a new era in
digital collaboration over the last 4 years. As Saveri et al. (2005) note, it
is possible to identify a series of ‘technologies of collaboration’. These
technologies are categorised as:
•
networks through self-organisation and link between themselves autonomously.
Examples for these are peer-to-peer networks, in which
different nodes in the network are using the resources of other nodes
in order to accomplish a task. For example, file-sharing networks that
are used to exchange multimedia files such as music or video.
•
resources among a group by voluntarily running applications on their
computers, and exploiting unused computing capacity. The Barkley
Open Infrastructure for Network Computing is one of the most
common software systems that allow such activities, and it has been
used to integrate thousands of home computers for modelling climate
change in an experiment which was run by the BBC and Oxford
University or in the search for extraterrestrial life in the SETI@home
project. In both cases, by breaking up the tasks and spreading them over
many computers, it becomes possible to complete a computationally
intensive task within a reasonable time.
•
task, often without monetary remuneration. For example, these are often
used in the development of open source software projects, which involve
groups of programmers and software designers working cooperatively,
such as the creation of an operating system (Linux) or a GIS (GRASS).
The term ‘volunteers’ has been used to describe the participants in such
activities (see Goodchild 2007a).
•
a group of people, some of whom are complete strangers. An example
is ‘smart mobs’ (Rheingold 2002) – groups of people gathering in a
given place at a given time through coordination via Short Messaging
Service on their mobile phones. The medium is used to coordinate an
activity by passing a message among groups of acquaintances, and the
final gathering creates a specific social activity such as a public pillow
fight or a more purposeful activity such as a political demonstration.
Self-organising mesh networks: software and hardware objects that createCommunity computing grids: situations where people share computingPeer production networks: enabling people to work together on a specificSocial mobile computing: technologies allowing coherent activities among2026 Web Mapping 2.0 and neogeography
© 2008 The Authors
Journal Compilation © 2008 Blackwell Publishing Ltd
Geography Compass 2/6 (2008): 2011–2039, 10.1111/j.1749-8198.2008.00167.x•
and interact. Examples include groups of collectors on eBay, or users
of local bulletin board systems. Both social and personal interests are
supported through this technology.
•
Social networking sites such as Facebook (www.facebook.com) have
enabled users to build profiles that can be shared through ‘friend requests’,
linking people from often disparate geographical locations into virtual
places. These networks of individuals are dichotomous between real and
virtual acquaintances. Real acquaintances are those networks of people
built from real-life associations such as friends, family or work colleagues.
Virtual acquaintances are made through a shared interest (e.g. the Facebook
group ‘GIS rules and so do we’) or a common motivating goal.
•
users. For example, the way in which sellers and buyers are rated on
eBay to create confidence between strangers.
•
and set the structures and rules of managing common resources. Examples
include wikis such as Wikipedia – shared areas where people can write
and keep information or Web logs (blogs) where people are sharing
opinions about various issues.
In the description of these collaborative technologies, it is important to
note that the emphasis is moving away from isolated technology into the
embodiment of technology within social activities. The following sections
provide three cases that demonstrate both the social and technological aspects
of Web Mapping 2.0. In each case, we provide a description of the application,
followed by a concise analysis that places them within this framework.
Group-forming networks: technologies that allow subgroups to be formedSocial software: probably the most common sites classified as Web 2.0.Social accounting tools: offering methods of establishing trust betweenKnowledge collectives: technologies that allow people to share information6 OpenStreetMap (http://www.openstreetmap.org/)
Virtual associations that can exist in social software have led to ‘crowdsourcing’
(Howe 2006), which has proven to be one of the most significant
and potentially controversial developments in Web 2.0 and neogeography.
This term developed from the concept of outsourcing where business
operations are transferred to remote cheaper locations (Friedman 2006).
Similarly, crowdsourcing is how large groups of users can perform functions
which are either difficult to automate or expensive to implement.
Tapscott and Williams (2006) discusses that ‘in many peer production
communities, productive activities are voluntary and non-monetary’;
content is created for free, for the development of the community.
The neogeography example of crowdsourcing is the project Open-
StreetMap (OSM). OSM is a project to create a set of map data that are
free to use, editable and licensed under new copyright schemes (Figure 6).
A key motivation for this project is to enable free access to current
© 2008 The Authors
Journal Compilation © 2008 Blackwell Publishing Ltd
Geography Compass 2/6 (2008): 2011–2039, 10.1111/j.1749-8198.2008.00167.xWeb Mapping 2.0 and neogeography 2027
geographic information in European countries where geographic information
is considered to be expensive. In the USA, where basic road data
are available through the US Census Bureau TIGER/Line programme, the
details that are provided are limited (streets and roads only) and do not include
green space, landmarks and the like. In addition, due to the cost of updates,
the update cycle is slow and does not take into account rapid changes.
The OSM data can be edited online through a wiki-like interface
where, once a user has created an account, the underlying map data can
be viewed and edited. A number of sources have been used to create these
maps including uploaded GPS tracks, out of copyright maps and, more
recently, aerial photographs through collaboration with Yahoo! Unlike
Wikipedia, where the majority of content is created at disparate locations,
the OSM community also organises a series of local workshops (called
‘mapping parties’) which aim to create and annotate content for localised
geographical areas (see Perkins and Dodge 2008). These events are designed
to introduce new contributors to the community with hands-on experience
of collecting data, while positively contributing to the project overall by
generating new data and street labelling as part of the exercise. The OSM
data are stored in servers at University College London (UCL) and Bytemark
which contributes the bandwidth for this project. While over 18,000 people
Fig. 6. High resolution map from OpenStreetMap of the area near University College London.
2028 Web Mapping 2.0 and neogeography
© 2008 The Authors
Journal Compilation © 2008 Blackwell Publishing Ltd
Geography Compass 2/6 (2008): 2011–2039, 10.1111/j.1749-8198.2008.00167.xhave contributed to the map as of December 2007, it is a core group of about
40 volunteers who dedicate their time to create a viable data collection
service. This includes the maintenance of the server, writing the core
software that handles the transactions with the server in adding and editing
geographic information, and creating cartographical outputs. The project
includes two editing tools that participants have developed as part of it
with a lightweight editing software package that is working within the
browser and another stand-alone version, more akin to a GIS editing package.
Involvement in the project requires the participants to be knowledgeable
about computers and GPS technology, in order to know how to collect
GPS tracks, upload the GPX files to their computers and then edit them
and upload them to the OSM server. The use of the data also requires
knowledge on how to extract the information from a database and convert
it into a usable format.
The OSM project provides a good example for the social and technical
aspects that were highlighted in the previous section. First and foremost,
OSM is a knowledge collective that is creating a meaningful geographic data
collection as its main objective. At the same time, it includes a peer production
network, as different groups within the organisation are focusing on the
development of different aspects of the project – digitising tools, rendering
software to display the maps, server software to host and coordinate the
production and delivery, and running activities such as mapping parties. It
is utilising community computing grids in the process of rendering the
various tiles through the programme Tiles@home, in which about 100
volunteers use their computers to render OSM tiles. OSM uses Social
Mobile Computing to an extent during the process of data collection,
especially during mapping parties where participants coordinate the work
using mobile GPS receivers and mobile phones. The group-forming
network can be seen on the main wiki, which contains information about
the project, and also through an array of active mailing lists, Internet Relay
Chats and other modes of CMC. Finally, social accounting is occurring
in OSM: for example, in highlighting the contribution of various members
of the OSM community through publication on a website of the amount
of computing they have contributed or the number of edits they have
carried out over the last week, month and year.
OSM also demonstrates some of the aspects that are significant in
neogeography. First, the API for downloading the data is very simple – all
that is required is latitude and longitude coordinates. This is in sharp
contrast to OGC APIs, which require multiple parameters. Second, the
OSM map itself is using AJAX technology and it is easy to integrate it
into other applications, as Nestoria has done in parts of the UK. On the
other hand, OSM data are not complete or consistent across the world, or
even across London, where the project has started. The accuracy of the
data is unknown, as there are no systemic and comprehensive quality
assurance processes integral to the data collection. Furthermore, there is
© 2008 The Authors
Journal Compilation © 2008 Blackwell Publishing Ltd
Geography Compass 2/6 (2008): 2011–2039, 10.1111/j.1749-8198.2008.00167.xWeb Mapping 2.0 and neogeography 2029
no intention of universal coverage or social equality as Steve Coast, the
founder of OSM, said in an interview: ‘Nobody wants to do council estates.
But apart from those socio-economic barriers – for places people aren’t
that interested in visiting anyway – nowhere else gets missed’ (GISPro 2007).
7 London Profiler (http://www.londonprofiler.org/)
Another example of the power of the new generation of Web mapping
to contribute to quick assembly of maps is the London Profiler (Gibin
et al. 2008), which was created by the Centre for Advanced Spatial Analysis,
UCL. Unlike the majority of GYM mash-up websites, the London Profiler
site presents geographic information as series of choropleth maps on top
of Google Maps rather than as simple points (push pins). Although the
Google Maps API enables vector shapes to be overlaid on their map data,
this is limited to a fairly small dataset, and as such not for extensive
geographical areas. To circumnavigate this problem, the vector data can
be transformed into an image format similar to the Google background
map, thereby enabling this information to be integrated seamlessly with
Google Maps information. The London Profiler website displays multiple
public domain datasets from a variety of sources for the Government Office
Region of London. The purpose of the website is to engage with decisionand
policy-makers from a variety of audiences and encourage them to make
more informed choices based on publicly available spatial information. By
overlaying these data onto Google Maps data, this enables contextual
information to be taken into account when making decisions (Figure 7).
Data layers include: the Multicultural Atlas of London (Mateos et al.
2007); E-Society Classification (Longley et al. 2006); HEFCE POLAR
Classification and Associated HE data (Corver 2005); National Statistics
Output Area Classification (Vickers and Rees 2007) and several others.
The website navigation uses the Google Maps interface. Users can add
or hide different data layers by clicking on the relevant tabs. A final feature
which enables users to incorporate their own data into London Profiler
is the ability to load publicly available files in Google Earth standard
(known as KML) onto the map. For example, using KML feeds from
Nestoria, discussed earlier, property information can be added to the
London Profiler website, thus enabling contextual information to be
considered when searching for a property (Figure 8).
The London Profiler is helpful in understanding some of the advantages
and problems in Web Mapping 2.0. The use of the application is very
smooth and rapid, so changing the map from one topic to another usually
takes less than 5 sec; hence, the user feels that the application is truly
interactive. The use of the map is based on the Google Maps interface,
and, therefore, the amount of learning required from the user is minimal.
The user is also able to select the topics that are of interest to them from
the list on the map, and view the information instantly. Furthermore, the
2030 Web Mapping 2.0 and neogeography
© 2008 The Authors
Journal Compilation © 2008 Blackwell Publishing Ltd
Geography Compass 2/6 (2008): 2011–2039, 10.1111/j.1749-8198.2008.00167.xuse of external information providers (Google for the background map,
Nestoria for property) means that a single person can effectively manage
the site as the focus is solely on the added value layers. On the negative
side, the map is using static ranges of colours and classification, and, therefore,
the user cannot explore the information in more detail. Furthermore, the
application is inherently cartographical and void of any analytical capacity.
However, it effectively demonstrates that Web Mapping 2.0 approaches
can be used very effectively as a means of disseminating results of research
to a wider audience. For example, the site has featured on the BBC online
(BBC 2008) website in a story about recent research conducted at UCL
into the ethnic composition of London neighbourhoods. Additionally,
over 18,000 people have visited the site since it launched.
8 Ordnance Survey OpenSpace (http://openspace.ordnancesurvey.co.uk/)
Ordnance Survey (OS) OpenSpace provides an API to access a range of
Ordnance Survey data that enable anyone registered for the service to start
building new applications which integrate other third-party information
(Figure 9). Additionally, the OS OpenSpace website provides a supporting
Fig. 7. The London Profiler interface displaying the income dimension of the lower super
output area for an area of London.
© 2008 The Authors
Journal Compilation © 2008 Blackwell Publishing Ltd
Geography Compass 2/6 (2008): 2011–2039, 10.1111/j.1749-8198.2008.00167.xWeb Mapping 2.0 and neogeography 2031
Fig. 8. Nestoria-generated KML for ‘SE6’ in London displayed on the Index of Multiple
Deprivation Hybrid Map with 75% visibility.
Fig. 9. Ordnance Survey OpenSpace.
2032 Web Mapping 2.0 and neogeography
© 2008 The Authors
Journal Compilation © 2008 Blackwell Publishing Ltd
Geography Compass 2/6 (2008): 2011–2039, 10.1111/j.1749-8198.2008.00167.xcommunity forum and developer information where users can share
resources and seek information. The site is the only mapping API to
support the British National Grid and additionally includes support for
different data formats such as OGC WMS and Web Feature Service standards.
The provision of Ordnance Survey data in an accessible API form aims
to stimulate community applications and involvement and was also recognised
as an important objective in the Power of Information Review
(Mayo and Steinberg 2007), which called for the opening up of public
information for the use of wider society. OS OpenSpace provides the rich
cartographic and contextual details of Ordnance Survey data that enable
a raft of rural community and outdoor exploration activities not possible
using the GYM offerings. Additionally, higher-resolution street details,
which include building outlines, also provide potential for different types
of urban- and neighbourhood-based applications. Given that the driving
forces of neogeography include community involvement, a resurgent sense
of place and collective ownership, the provision of such content may yield
interesting new applications.
The OS OpenSpace has the potential to drive the use of OS geographic
information across the Web by a wide community of independent
developers, small Web and media companies, social groups and organisations
as well as large corporate and government organisations. However,
it is unclear how these latter groups engage with the accompanying
aspects of community building, crowdsourcing, etc. Furthermore, although
some community groups and non-governmental organisations have the
capacity to utilise Web technologies as part of their activities, many organisations
and groups are not capable of taking advantage of this development
due to lack of technical skills and resources. The introduction of
neogeography-type services by OS may prove significant in fostering
these types of developments into the more mainstream geographic
information market.
In terms of our overview of Web Mapping 2.0, OS OpenSpace is
raising some important aspects. First, it demonstrates how major providers
of geographic information, who are part of the traditional ‘geography’ to
which neogeography is positing itself against, are adopting the innovations
of Web Mapping 2.0 within their current offering and infrastructure.
Second, the use of a local grid reference, and not the ubiquitous latitude/
longitude which is common in neogeography, provides an accessible
reference that answers the needs of the specific locality. This is significant,
as the approach that the GYM is promoting is of an imaginary globalised
and ubiquitous data provision. Third, OpenSpace is demonstrating how
governmental and commercial organisations can build on Peer Production
Network – OpenSpace is based on OpenLayers, an Open Source library
developed to provide a framework for accessing geographic information
over the Internet. The adoption of OpenLayers enabled the OS to develop
OpenSpace – for example, in terms of documentation and examples.
© 2008 The Authors
Journal Compilation © 2008 Blackwell Publishing Ltd
Geography Compass 2/6 (2008): 2011–2039, 10.1111/j.1749-8198.2008.00167.xWeb Mapping 2.0 and neogeography 2033
Finally, the need for OpenSpace itself came about from the growing
interest in location and geography sparked by Web Mapping 2.0.
9 Implications and critique
The three case studies demonstrated how Web Mapping 2.0 and neogeography
concepts are influencing the development of geographic information
applications in a voluntary environment, at a university and in a national
mapping agency. In this part, we turn to the implications of these rapid,
open, innovative, collaborative, and interactive developments.
9.1
GEOGRAPHIC INFORMATION PROVIDERSAs with other media content providers (e.g. music and news media), the
general information provision model has now changed. It has changed
from a linear, publishing ‘push’ model where data and information is
collected and brought together centrally, turned into product and published
to an inter-networked, participatory model where users also collaboratively
create, share and mash-up data and where information can be accessed
through many channels, almost anywhere, when the user wants it. Additionally,
the role of the traditional information provider may change
(Parker 2007). The increased prevalence of user-generated content (including
products and services) is blurring the difference between producers and
consumers in what is sometimes termed
of users as innovators, experimenting with new products and services on
open innovation platforms, such as OS OpenSpace.
However, these changes are challenging current conceptions and practices
in data provision. When all can potentially capture and distribute data through
access to GPS, the Internet and mobile devices, what information can
users trust? Another profound change is in the business models of data
providers as, for many applications, data can be accessed freely either from
voluntary sources or from commercial providers through their APIs. This
can also have an impact on software vendors, at least in some WMS
applications. An emerging role for the traditional information provider is
to perform a data verification function, to facilitate ease of use of and ease
of access to the required information, and to ensure a good user experience,
and it might be these roles that will become central to the activities of
data providers (Parker 2007).
prosumer. There is also a realisation9.2
COLLABORATION
GEOGRAPHY AND GISCIENCE – CULT OF THE AMATEUR OR MASS?In a commentary on the wider Web 2.0 debate, Keen (2007) questions
what he calls the ‘Cult of the Amateur’ encouraged by Web 2.0. He
questions the consequences of blindly supporting a culture that endorses
2034 Web Mapping 2.0 and neogeography
© 2008 The Authors
Journal Compilation © 2008 Blackwell Publishing Ltd
Geography Compass 2/6 (2008): 2011–2039, 10.1111/j.1749-8198.2008.00167.xplagiarism, piracy and fundamentally weakens traditional media, creative
and scholarly institutions. Keen cautions that ‘we [need to] use technology
in a way that encourages innovation, open communication, and progress,
while simultaneously preserving professional standards of truth, decency,
and creativity’. Tapscott and Williams (2006) describe a growing economy
driven by mass collaboration based on the principles of openness, peer
production, sharing and acting globally. Through different examples they
tease out the guidelines by which to succeed in this environment. One
suspects the answer lies with the appropriate use of both approaches to
varying degrees according to the challenge being faced.
A similar debate has started in the geographic information community
where it is apparent that the notion of neogeography contains within it
certain disregard to existing geographical and cartographical traditions,
and an even more overt disregard to the whole area of GIS and GIScience.
The following example, from one of the core activists of OpenStreetMap:
There’s also a darker side to the complexity of traditional GIS. The fact that
someone needs a master’s degree in GIS to work as a GIS Technician should
set alarm bells ringing. By maintaining the complexity of GIS, vendors like
ESRI or Oracle are able to justify the costs of their products and consultants
are able to justify their high fees and trade organisations justify their [sic.]
existence. (Black 2007)
A similar derogatory disregard to the efforts of researchers of GIS/2 can
be found in Miller (2006).
Importantly, naïve conceptualisations of geography as the location of
factual objects in space, a lack of understanding of spatial analysis and a
dismissive attitude to geography, cartography and GIS were identified by
Unwin (2005) among general GIS users (‘accidental geographers’ as Unwin
calls them). However, within neogeography they are seen by some as part
of the core ideology. Similar to Wikipedia’s core values, these are based
on strong techno-libertarian politics (Keen 2007), which are especially
common with high-tech and Internet culture (Borsook 2000; Hodgkinson
2008). Thus, the concepts of collaboration, cooperation, sharing and
openness should be seen within a context of a capitalist mode of production
where the collaboration is done from personal motives and in advancement
of personal wealth, and less as an altruistic activity.
Regardless of these ideological undertones, it is important to acknowledge
how neogeographic techniques and collaborative ways of working
have demonstrated reduced development time and improved usability.
They have raised general awareness of geographic information, the earth
and the relationships between people and processes to potentially millions.
These new techniques do not negate the importance of spatial analysis or
cartography or surveying used in traditional geography and GIScience. It
is not either one or the other, and there is clearly a space for both, so a
synergistic approach is required.
© 2008 The Authors
Journal Compilation © 2008 Blackwell Publishing Ltd
Geography Compass 2/6 (2008): 2011–2039, 10.1111/j.1749-8198.2008.00167.xWeb Mapping 2.0 and neogeography 2035
Web Mapping 2.0 can influence GIScience by raising new questions
and can offer novel data sets. For example, this will include data interoperability
between neogeography data sets and traditional GIS ones, including
semantic interoperability or maintaining the quality, integrity and currency
of (crowd) sourced content. It also provides large quantitative and qualitative
data sources that can be used to answer long-standing research questions.
These new developments are also providing a fruitful area for geographic
research. Some of the questions that are emerging include: what
kind of participatory practices are emerging with the support of these
technologies and how do they influence the relationship between people
and places? What kind of cultural and conceptual understanding of space,
scale and geography are being used and how are the human concepts of
geographical space emerging through these systems? In what ways are
computer systems constraining the geographical imagination of their users?
The current wave of technologies provides a rich source of empirical
evidence at a scale that was not available before. These are relevant for all
current research frameworks in geography from the positivist to the critical.
GIS has provided a number of powerful techniques to add to the
geographer’s toolbox. Web Mapping 2.0 and neogeography have added
more and made the former easier to use and information easier to access
and convey to millions. The potential of these open, collaborative techniques
to address challenges, be they local or global, is very significant.
Through neogeography, satellite navigation systems and similar technologies,
many people are exposed to geographic information and may
be fascinated with the concepts behind these technologies. There is
clearly a large pool of enthusiastic amateurs with significant interest
and willingness to invest their time and effort into the use of these
technologies. As Massey (2006) noted, it is time to put the geography
back into global thinking and this is an opportunity that should be seized
by geographers.
Short Biographies
Mordechai (Muki) Haklay is a Senior Lecturer in GIScience at UCL,
where he is also the director of UCL Chorley Institute – an interdisciplinary
research centre, with an aim to provide computer visualisation and
modelling for UCL strategic research activities. He has written on issues
of public access to environmental information, usability of GIS and other
aspects of geographical information science. He has published in
International Journal of GIScience
research, he is interested in Participatory GIS and been following Open
Street Map over the last 3 years. He holds a BSc and MA from the
Hebrew University of Jerusalem and a PhD from UCL.
Alex Singleton is the Spatial Literacy Research Officer at UCL. He recently
completed a successful Knowledge Transfer Partnership at the Universities
Area, theand in several edited books. As part of his2036 Web Mapping 2.0 and neogeography
© 2008 The Authors
Journal Compilation © 2008 Blackwell Publishing Ltd
Geography Compass 2/6 (2008): 2011–2039, 10.1111/j.1749-8198.2008.00167.xand Colleges Admissions Service where he developed geodemographic
profiling tools and techniques to enable UK Higher Education institutions
to target and engage with under-represented groups. Alex’s recently completed
PhD explored the geodemographic analysis of access inequality in
Higher Education, including the modelling of neighbourhood participation
rates, prior performance and progression. His research has involved
collaboration with numerous data partners including the Universities and
Colleges Admissions Service, the Higher Education Statistics Agency, the
Learning and Skills Council and the Department for Children, Schools
and Families. He holds a BSc in Geography from the University of Manchester
and a PhD from UCL.
Chris Parker headed Research & Innovation at Ordnance Survey, Great
Britain’s national mapping agency, and is now engaged in the Organisation’s
product and service strategy. He has written and presented on research
challenges and future trends for geographic information providers, and the
use of geographic information in emergency management. He has published
in
geographer and land resources scientist experienced in the public, private
and third sectors, at home and overseas, he has a keen interest in designing
for ease of use and collaborative use of geographic information applied to
societal challenges. He holds a BA from Nottingham University and a
MSc and PhD from Cranfield Institute of Technology.the Cartographic Journal and several edited books. A practising
Subscribe to:
Posts (Atom)